
Connection Pool V2 in Microsoft.Data.SqlClient — Faster Does Not Always Mean Faster
Connection Pool V2 in Microsoft.Data.SqlClient — Faster Does Not Always Mean Faster
Does the new connection pooling mechanism actually make .NET applications faster? Microsoft described a new pool implementation in Microsoft.Data.SqlClient, designed to improve the concurrent opening of new physical connections. I decided to test it in my own SQL Server 2022 lab.
It started with a small benchmark, followed by 500 trials in randomized order, another 280 diagnostic measurements, and finally dotnet-trace traces and CPU sampling in PerfView. The result? Pool V2 clearly wins with OpenAsync(), but at 500 concurrent synchronous Open() calls it was slower than V1 in my lab.
This does not measure SQL query execution times. It measures the cost of building a cold connection pool — a crucial distinction.
What actually changed in the pool?
In the older implementation (called Pool V1 here), the creation of new connections within a single pool involves a significant degree of serialization. Pool V2 changes how concurrency is organized and uses, among other things, System.Threading.Channels to improve the concurrent creation of physical connections.
With many simultaneous opens, this should especially benefit asynchronous operations. Greater concurrency can also increase client-side costs: authentication, runtime execution, thread management, and operating-system calls. That is why I measured CPU in addition to wall-clock time. Wall-clock time is the elapsed time between the beginning and end of an operation, whether the CPU was actively working or the application was waiting. In .NET, it can be measured with Stopwatch.
Environment and methodology
| Component | Configuration |
|---|---|
| Application | C#, .NET 10, Release |
| Client | Microsoft.Data.SqlClient 7.1.0 |
| Server | SQL Server 2022, localhost, master database |
| Operating system | Windows |
| Authentication | Integrated Security=True |
| Encryption | Encrypt=True;TrustServerCertificate=True (lab only) |
| Tools | PowerShell 7, dotnet-trace, PerfView |
| SQL queries | None; only connection opening was measured |
Example connection string:
| |
Each run opened the specified number of connections and kept them open until the opening phase was complete. This prevented closing and reusing connections from distorting the measurement. I measured the time needed to open the complete set, not the sum of individual call durations.
The main experiment comprised 500 trials, covering V1/V2, Open()/OpenAsync(), and concurrency levels of 10, 25, 50, 100, 200, and 500. Configurations were shuffled using reproducible random seed 20261104, and every trial started a new .NET process (a cold pool). Each configuration had approximately 20–21 measurements; some summary cells contained 20 valid runs, so the analysis uses successfully completed rounds.
I then ran 280 diagnostic trials: seven concurrency levels (200 to 500 in steps of 50), two implementations, two modes, and ten repetitions per configuration. These measurements separated worker preparation from the timed connection-opening phase.
Finding 1: OpenAsync() — V2 wins
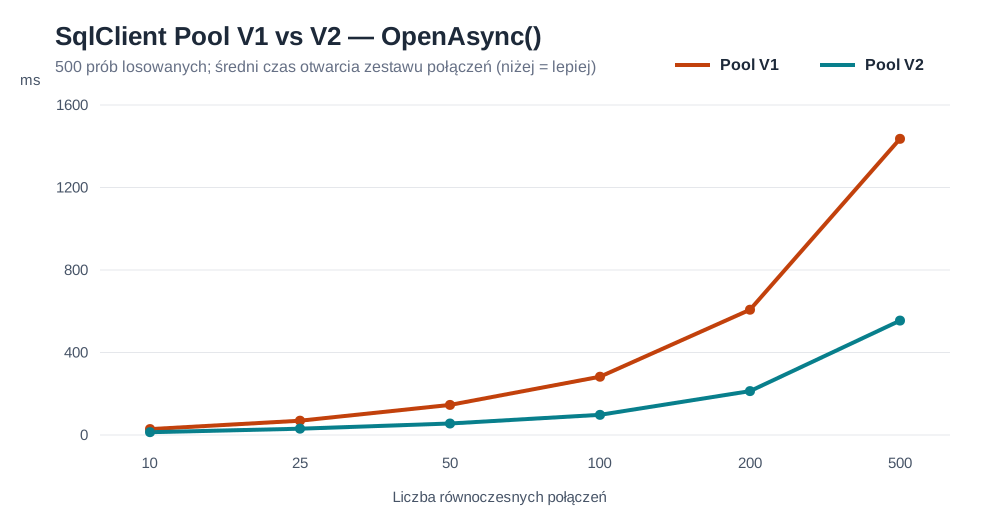
The chart below shows the mean time to open the full set of connections in the 500-trial experiment.
| Concurrent connections | Pool V1 | Pool V2 | V2 speedup |
|---|---|---|---|
| 10 | 28.80 ms | 13.79 ms | 2.09× |
| 25 | 69.38 ms | 30.75 ms | 2.26× |
| 50 | 145.88 ms | 55.67 ms | 2.62× |
| 100 | 282.55 ms | 97.70 ms | 2.89× |
| 200 | 607.43 ms | 212.84 ms | 2.85× |
| 500 | 1435.96 ms | 554.77 ms | 2.59× |
At 500 connections, V2 reduced the mean time from approximately 1.44 s to 0.55 s. In the separate diagnostic experiment with 500 OpenAsync() calls, I measured 1399.16 ms (V1) versus 463.07 ms (V2), a 3.02× speedup. The direction of both results agrees: when building a cold pool under high asynchronous concurrency, the new mechanism delivers a real benefit.
Finding 2: synchronous Open() — the advantage disappears
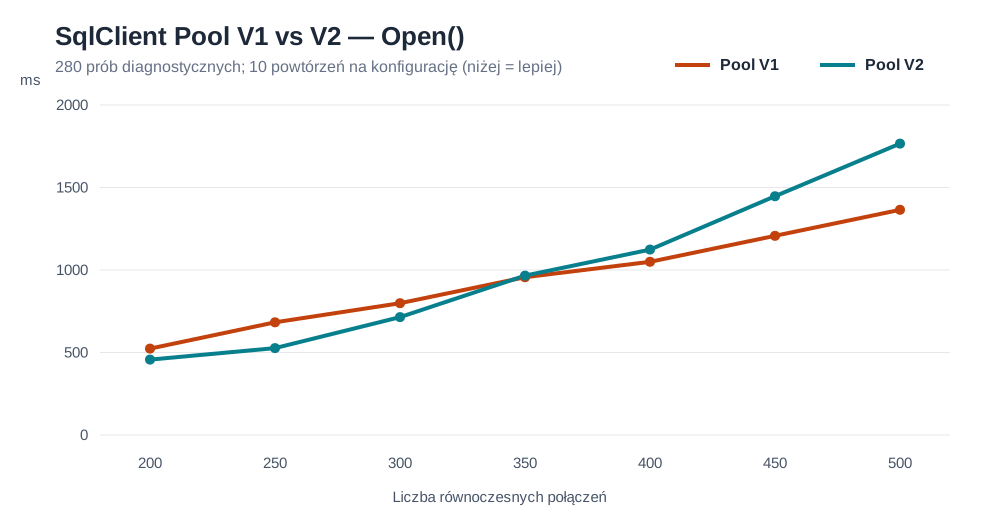
In the main 500-trial experiment, V2 was faster from 10 to 200 connections. At 500, the outcome reversed: V1 took 1595.79 ms, while V2 took 1951.63 ms. V2 was thus approximately 22.3% slower, based on the V2/V1 elapsed-time ratio.
To investigate whether this was a one-off fluctuation, I ran another 280 trials with denser measurements between 200 and 500 connections:
| Concurrent connections | Pool V1 | Pool V2 | V2 speedup |
|---|---|---|---|
| 200 | 523.55 ms | 457.02 ms | 1.15× |
| 250 | 682.90 ms | 526.61 ms | 1.30× |
| 300 | 798.80 ms | 714.50 ms | 1.12× |
| 350 | 956.20 ms | 965.86 ms | 0.99× |
| 400 | 1049.80 ms | 1123.84 ms | 0.93× |
| 450 | 1207.03 ms | 1447.06 ms | 0.83× |
| 500 | 1364.86 ms | 1765.86 ms | 0.77× |
In this series, the curves crossed at about 350 connections. At 500 synchronous connections, V2 was approximately 29.4% slower. This is not a universal SqlClient threshold: it is a result specific to this workload and environment.
What do the CPU metrics tell us?
Additional metrics helped distinguish worker preparation from client activity. In the diagnostic series at 500 synchronous connections:
| Metric | Pool V1 | Pool V2 |
|---|---|---|
| Mean cumulative process CPU time | 1117 ms | 4445 ms |
| Peak thread count | 513 | 514 |
| Mean worker preparation time | 52.1 ms | 49.7 ms |
| Managed allocations | 22.0 MiB | 23.0 MiB |
In this series, V2 consumed roughly four times as much cumulative CPU time, although worker preparation time and peak thread count were similar. This is strong motivation for further profiling, not proof of an algorithmic defect.
The OpenAsync() results also demonstrate that the extra activity is not an inherent feature of every V2 execution path.
PerfView: looking one level deeper
I collected PerfView ETW traces for V1/Sync/500 and V2/Sync/500. Both variants completed five successful rounds (500 connections each, without errors). In this phase, rounds ran in one process using ClearAllPools(); the conditions are therefore not identical to the earlier “new process per trial” experiment.
| Profiled implementation | Mean time to open the full set |
|---|---|
| V1, Sync, 500 | 1374.06 ms |
| V2, Sync, 500 | 1826.04 ms |
Under the profiler, V2 was also approximately 32.9% slower. However, these timings should not be directly combined with measurements collected without profiling.
After loading Windows symbols, CPU samples included the following kernel functions:
ntoskrnl!ObpLookupObjectName— kernel object name lookup;ntoskrnl!ExAllocateHeapPoolandExFreePoolWithTag— kernel memory allocation and release;ntoskrnl!SwapContext— context switching;ntoskrnl!KeWaitForSingleObject— waiting for an object.
Sample Exc values (a PerfView sampling metric) were:
| Function | V1 Exc | V2 Exc |
|---|---|---|
ObpLookupObjectName | 24 | 741 |
ExAllocateHeapPool | 54 | 654 |
ExFreePoolWithTag | 35 | 578 |
SwapContext | 39 | 390 |
These are not function-call counts or precise durations attributed to each function. The two traces have different durations and sample counts. This comparison points toward further diagnostic work; it does not, by itself, establish the cause.
In the V2 traces I also observed ChannelDbConnectionPool.GetInternalConnection(), Task processing, and waiting operations. The profile included a .NET Tiered Compilation Worker, which means some of the cost involves JIT compilation and runtime behavior. With Integrated Security=True, Windows authentication is another factor.
Working hypothesis: at extremely high synchronous concurrency, the benefits of creating connections in parallel may be offset by additional operating-system work, authentication, and synchronization overhead. Profiling has not proven a specific root cause. More precise isolation of CPU stacks, JIT activity, and native calls would be required.
Should Pool V2 be disabled?
I would not draw that conclusion. In my experiments, asynchronous Pool V2 won consistently, while synchronous V2 was faster at lower concurrency. Creating 500 new physical connections at once is a stress scenario, not a typical steady state of a properly functioning application.
In practice, the key benefit is reusing connections from a warm pool. This experiment did not measure query throughput or application latency with a warm pool. Nor did it compare remote SQL Server instances, Azure SQL, or Linux.
For .NET developers, the lesson is to benchmark real application workload patterns and distinguish Open() from OpenAsync(). For SQL Server DBAs, it is a reminder that not every delay observed in an application originates in the database engine. A problem may arise before any query reaches the optimizer — in SqlClient, authentication, the runtime, or the operating system.
Conclusions
- In this lab, Pool V2 accelerated
OpenAsync()by up to approximately 3× when building a cold pool. - For synchronous
Open(), the advantage diminished as concurrency increased; repeated tests at 500 connections found V2 slower. - CPU profiling showed substantially higher process CPU cost and more activity in system code, but did not conclusively identify the causal mechanism.
- These findings apply to one configuration. They are not a recommendation to disable Pool V2 or a universal concurrency limit.
The question that started the experiment was: Is the new pool faster?
The answer is: yes — but not in every scenario. That is why benchmarks should reflect real workloads and why, after obtaining initial numbers, it is worth looking deeper than Stopwatch.
Source code and reproducibility
I have published the C# (.NET 10) benchmark application and PowerShell scripts for randomized testing, diagnostics, and CPU profiling in the SQLManiak repository:
Benchmark source code — SQLManiak / scripts / SqlClientPoolBenchmark
The code is in scripts/SqlClientPoolBenchmark. Instructions and limitations are documented in README.md. It is provided so that readers can reproduce the measurements in an isolated lab. Do not initiate 500 simultaneous connections without assessing the impact on the server.
Example test:
| |
I am not publishing raw ETW traces or environment data. Results obtained in other environments may differ.
Sources and further reading
- Microsoft — Try SqlClient’s new connection pool for faster parallel connections
- Microsoft.Data.SqlClient — source code
- Microsoft PerfView
- Microsoft — dotnet-trace
Measurements were taken on November 4, 2026, in the SQLManiak lab. All reported results come from experiments on one workstation and do not guarantee performance in other environments.